17 Hilarious Graphs. Number 9 is Sooo True
It seems as though the more time passes the more we need colourful pictures and graphs to explain exactly what is going on around us. Take a look below and see how some of the basic things we conceive and do everyday is graphed in a funny way and make you think “That is so true!”
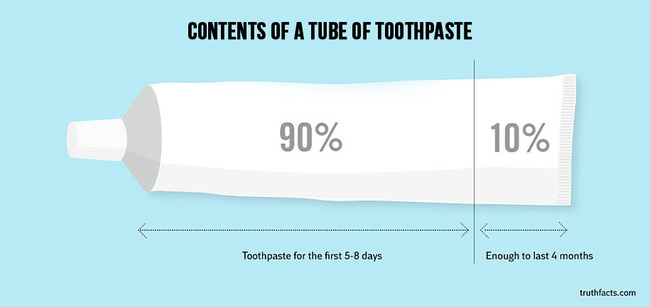
1) I’ve been running on 10% for the last 3 months strong!
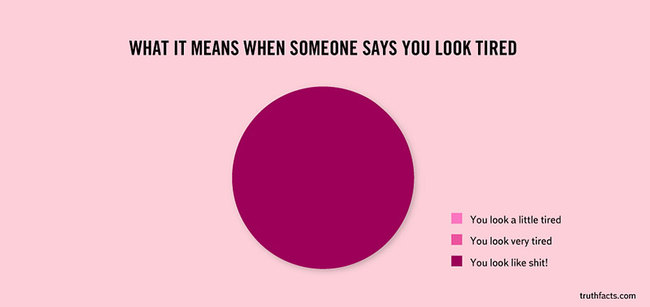
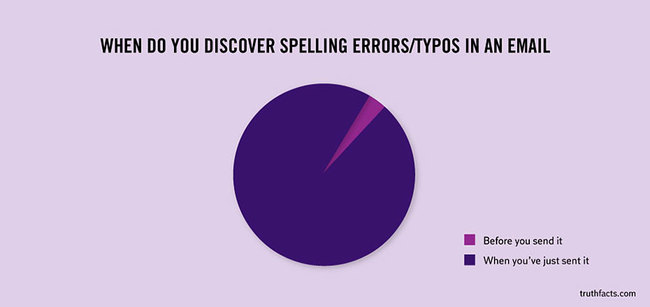
2) Now I get it.
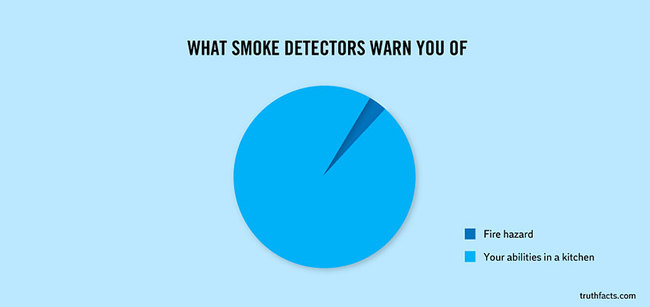
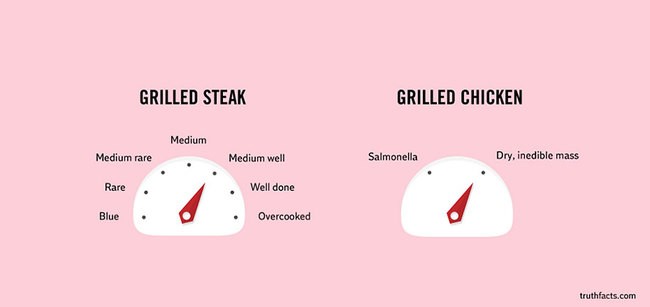
3) I’m proud to say the smoke detector has never lied about my cooking.
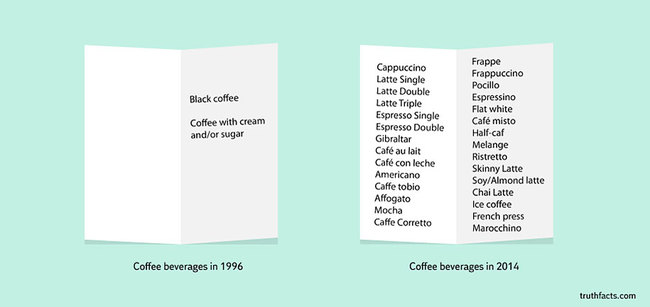
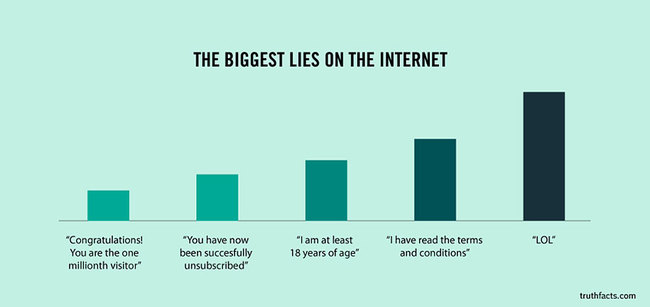
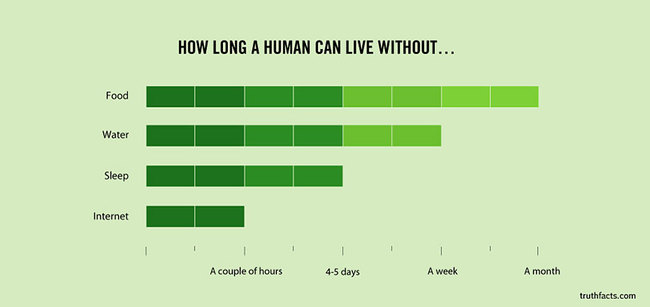
4) As someone who has been around the internet since it’s conception I can say, officially, this is so true.
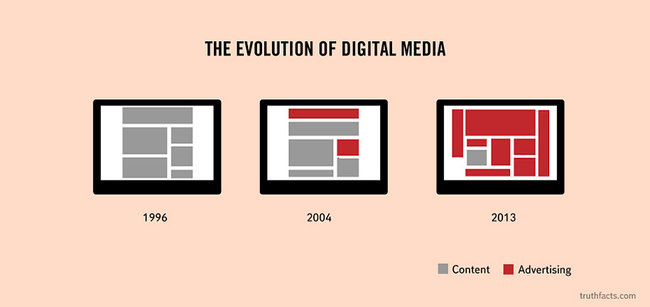
5) Let’s not forget this is out of about the 20% of actual content.
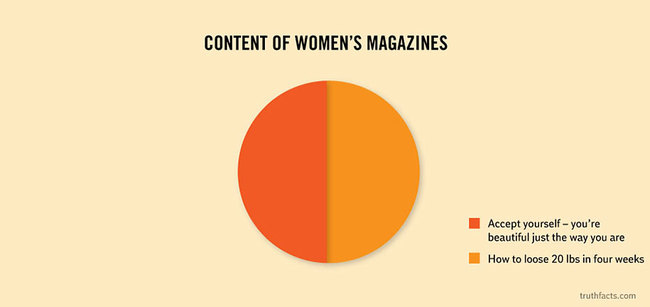
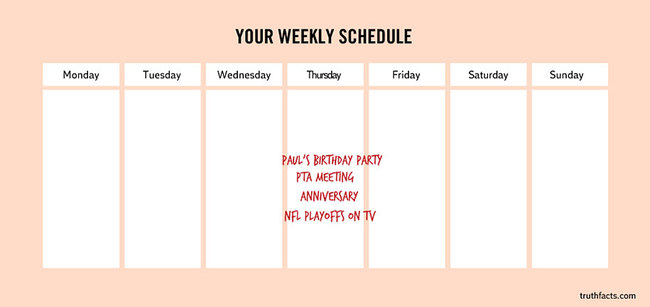
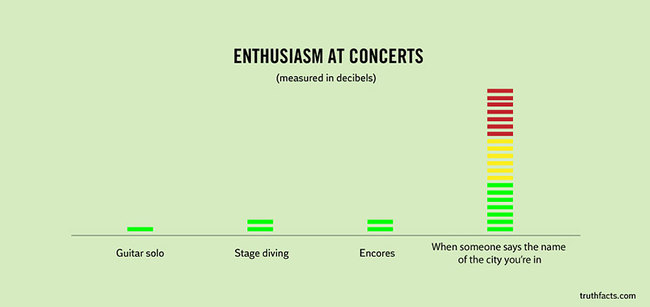
6) From your cold dead hand.
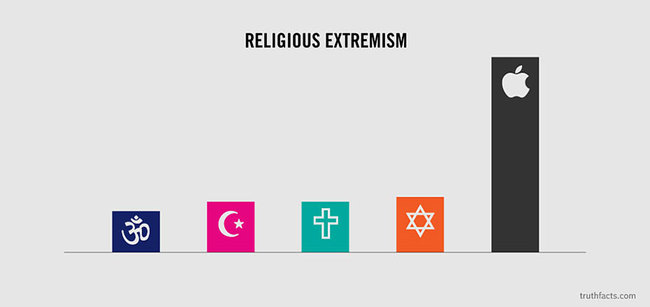
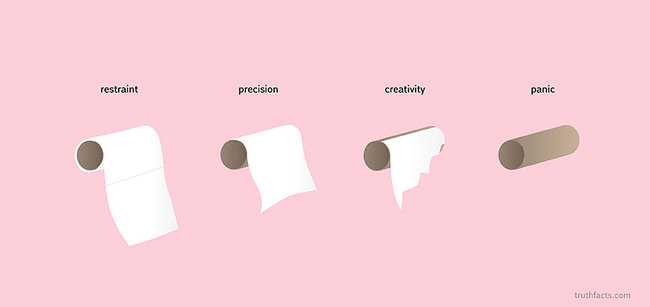
7) I’ve been there
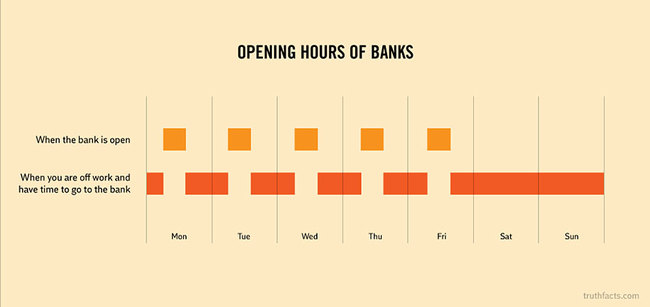
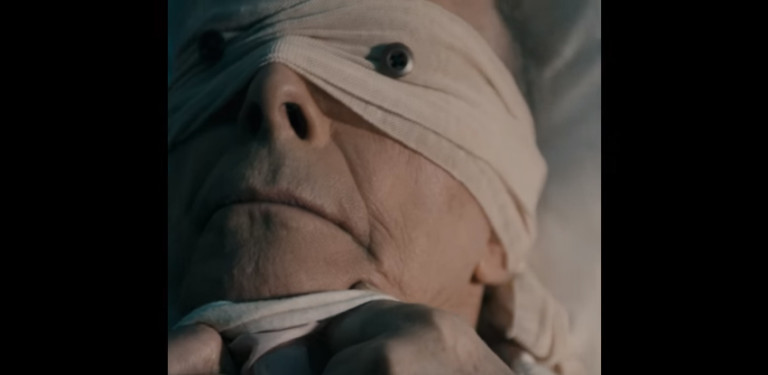
8) Worse is when you are at the panic level, you have to resort to the flimsy kleenex tissues sitting on the counter.
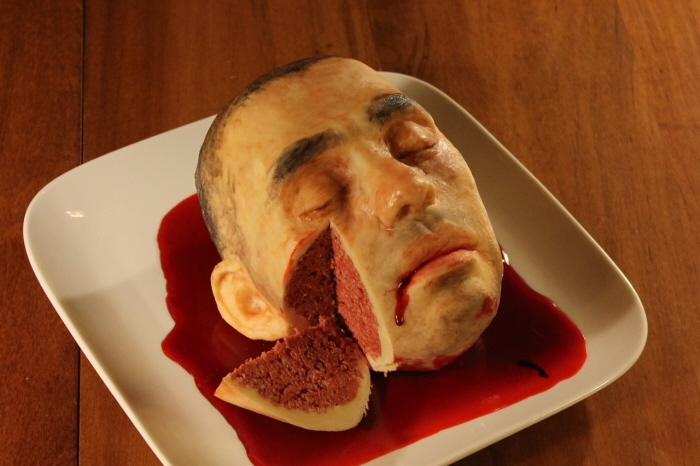
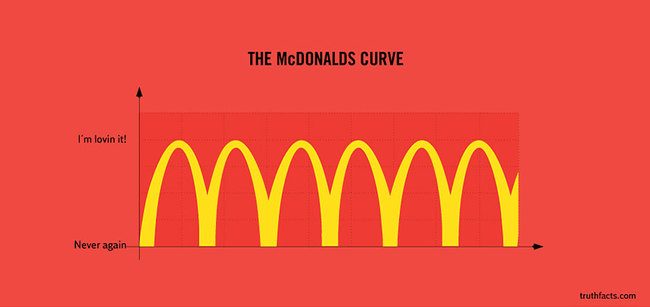
9) This is so true, especially after downing a Sausage Egg Mc Muffin trio
10)Always happens
11) Hahaha
12) LOL ?
13) Hate when this happens.
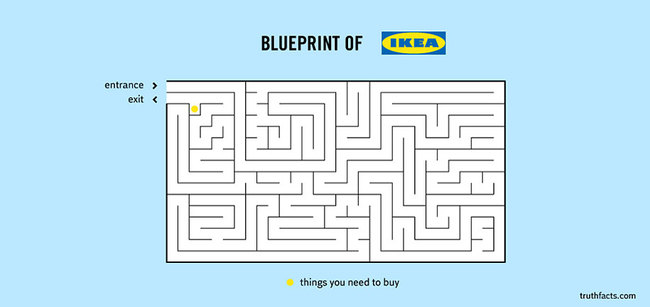
14) Like mice in a maze.
15) Yes!
16) I definately fall into this…
17) Sad but true